A business dashboard pulls the numbers from every tool you use into one live view, so you stop making decisions on last week's data assembled by hand. Automated reporting takes the next step: it builds and sends the report on a schedule with zero manual work. This guide covers what belongs on a dashboard, how automated reporting works, and what it costs to never build a report by hand again.
Why Manual Reporting Quietly Costs So Much
The cost is not just the hours. It is the lag. By the time a report is built by hand, the data is already old, and decisions get made on a gut feel because the real numbers are a half-day of work away. One agency we audited was spending 14 hours a week rebuilding the same client reports. That is a full-time role, spent assembling numbers a machine could assemble in seconds.
What Belongs on a Live Dashboard
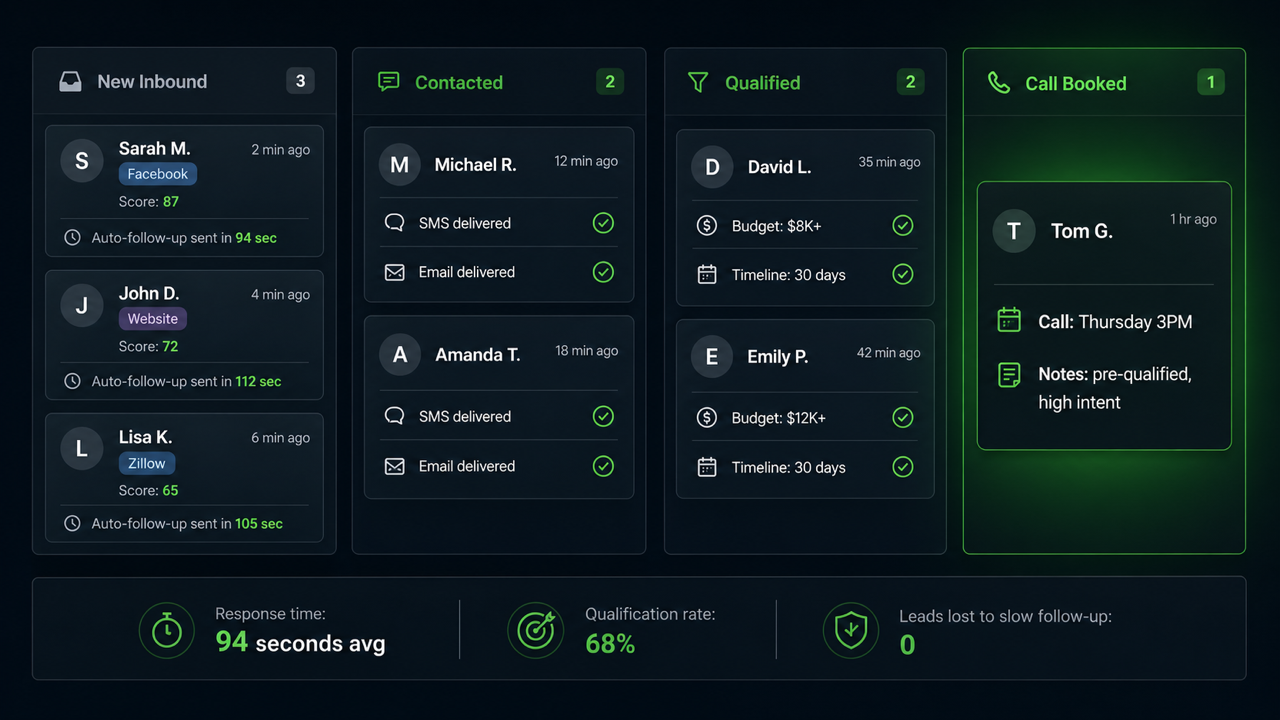
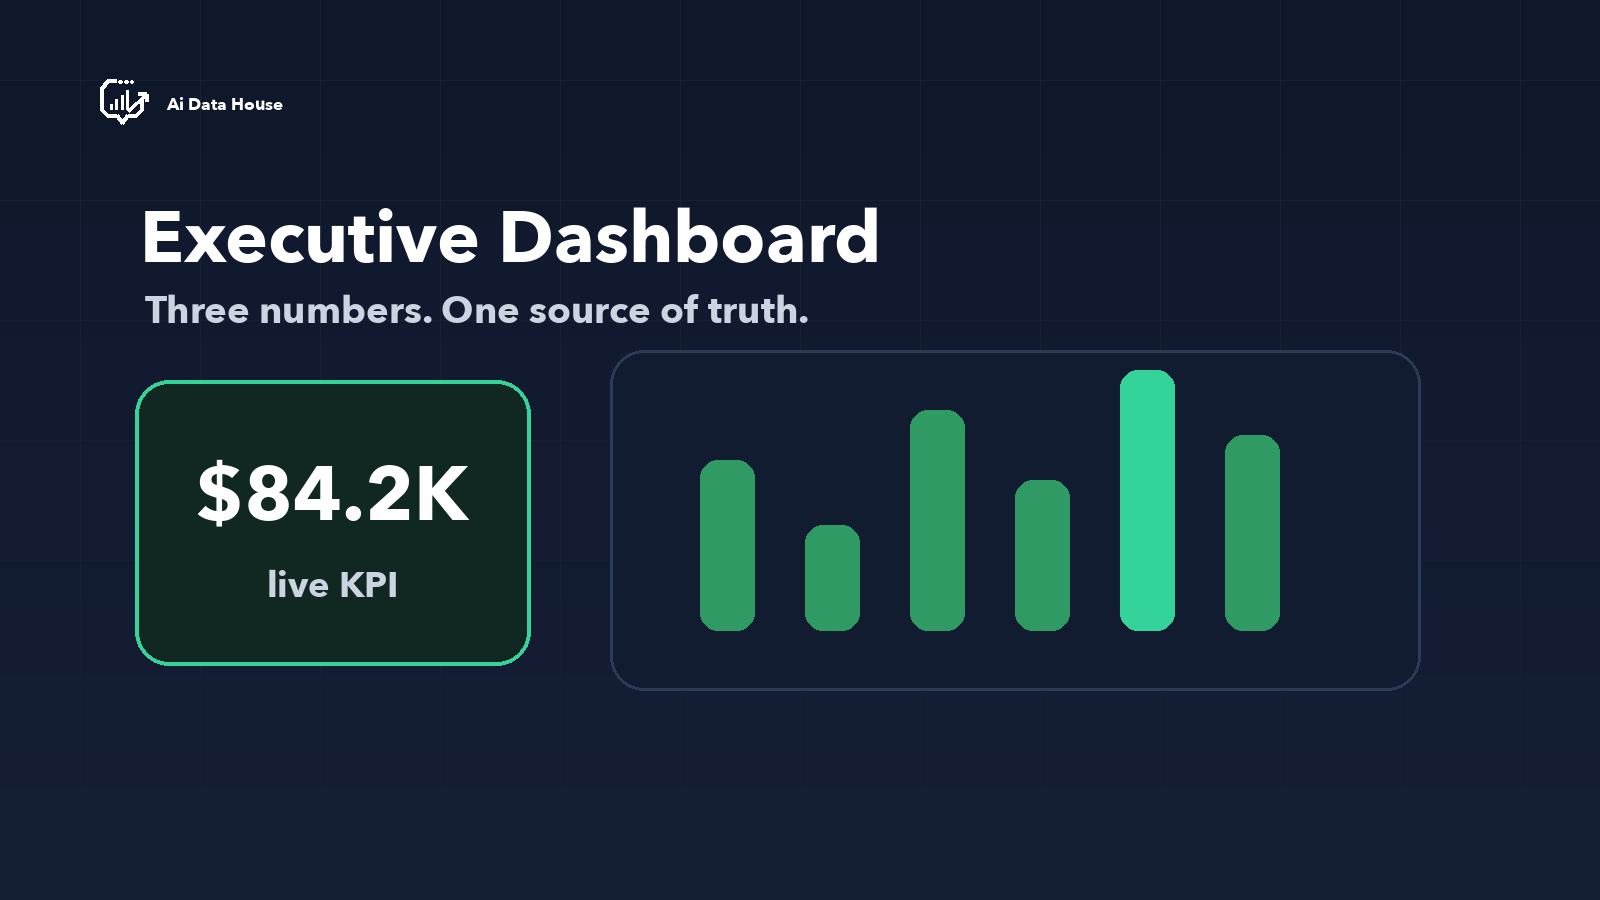
Put the numbers you would change a decision over, grouped by who needs them. Sales sees pipeline and response times. Operations sees throughput and bottlenecks. Leadership sees the few metrics that signal whether the month is on track. A dashboard with everything on it is a dashboard nobody reads.
How Automated Reporting Works
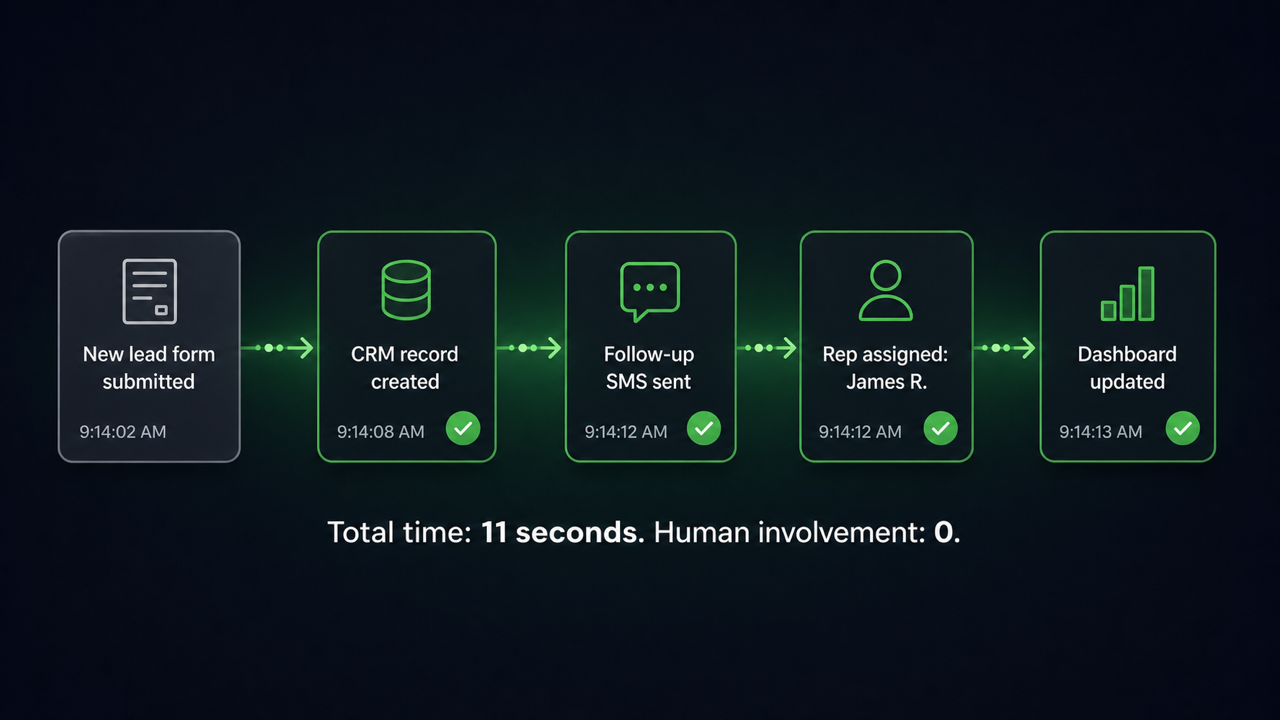
Your tools connect to a reporting layer that refreshes on a schedule. The dashboard updates itself, and the recurring report generates and sends itself to the right people on the same day every week or month. For the few clients or executives who prefer a human to press send, you keep a manual-send mode. Either way, nobody rebuilds anything.
Fourteen hours a week, back.
An 11-person agency managing 26 retainer clients was spending 14 hours a week building reports by hand. We automated the whole thing. Reporting time dropped to near zero, errors disappeared, and the reclaimed time went into winning three new clients in six weeks.
Go deeper
Still building reports by hand?
Book a free 30-minute AI Audit. We map your reporting and show you exactly what can be automated and what it would save.